What makes this breakout strategy different?
Many breakout scripts keep opening new trades whenever price moves above or below a level. This one is deliberately more restrained. It builds one range from the early part of the broker day, places two pending breakout orders, and only allows the first one to become a position. After that, it is finished for the day.
There is also no fixed take-profit target. A trade stays open until its stop-loss is hit or the configured closing time arrives. That makes the rules easy to follow, although it also means a profitable trade can give back part of its move before the time exit.
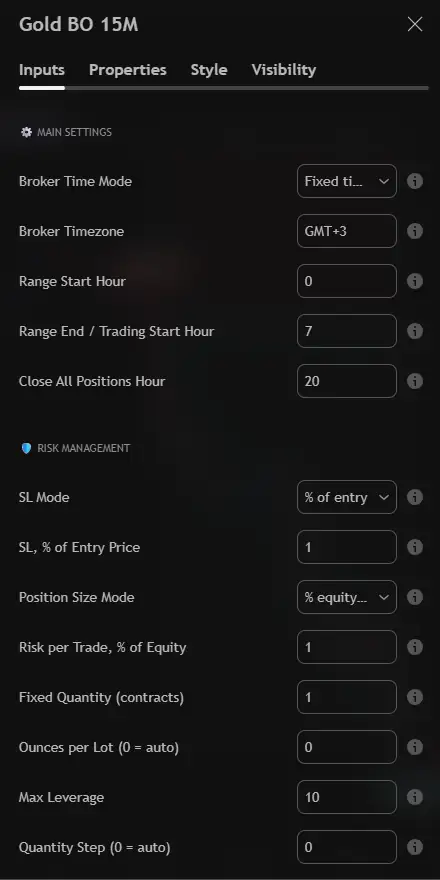
Those hours use broker time, not necessarily your local time. The default fixed timezone is GMT+3, and the script also has a New York + 7 hours broker clock mode for brokers following that convention.
How a trade is opened and closed
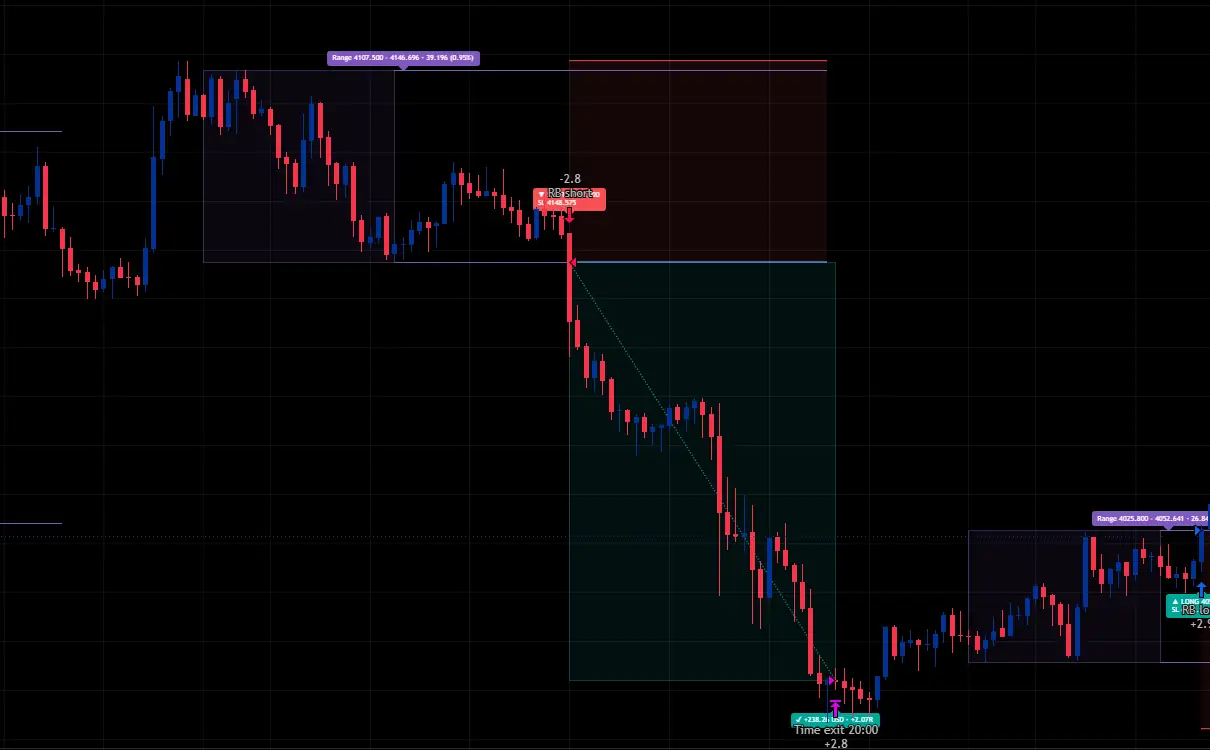
- Build the range. Between 00:00 and 07:00, the script records the highest high and lowest low on the chart.
- Place both breakout orders. At the end of that window, it prepares a buy stop at the range high and a sell stop at the range low. These are pending orders, not market orders placed simply because the clock reaches 07:00.
- Take the first breakout. The first order filled becomes that day's position. The opposite order is cancelled, so the strategy does not reverse and trade back and forth all day.
- Exit by stop or time. There is no take-profit. An open position closes at its stop-loss or is scheduled to close at 20:00 broker time. The script runs on confirmed bars, so the close order fills on the next available bar in the TradingView simulation.
It is possible to have no trade on a day when neither boundary is crossed during the trading window. The strategy also skips the first day of loaded chart history because the overnight range may be incomplete.
What the long and short trades look like
The source document includes both directions, which is useful because the strategy does not assume that gold has to rise. It reacts to the boundary that breaks first.
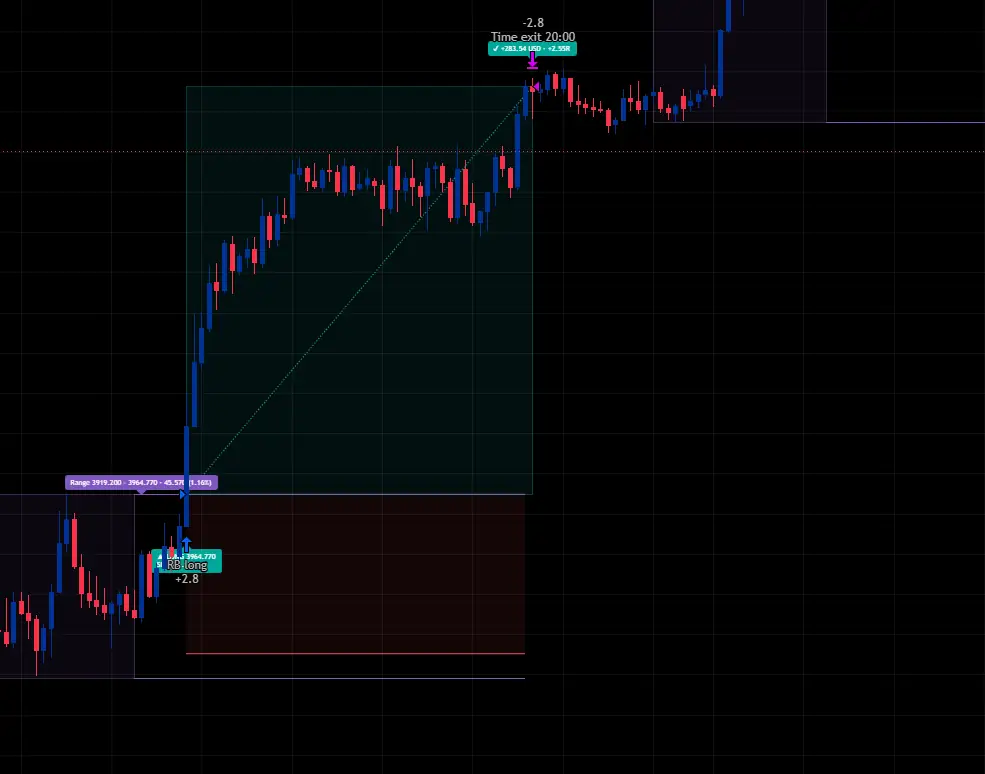
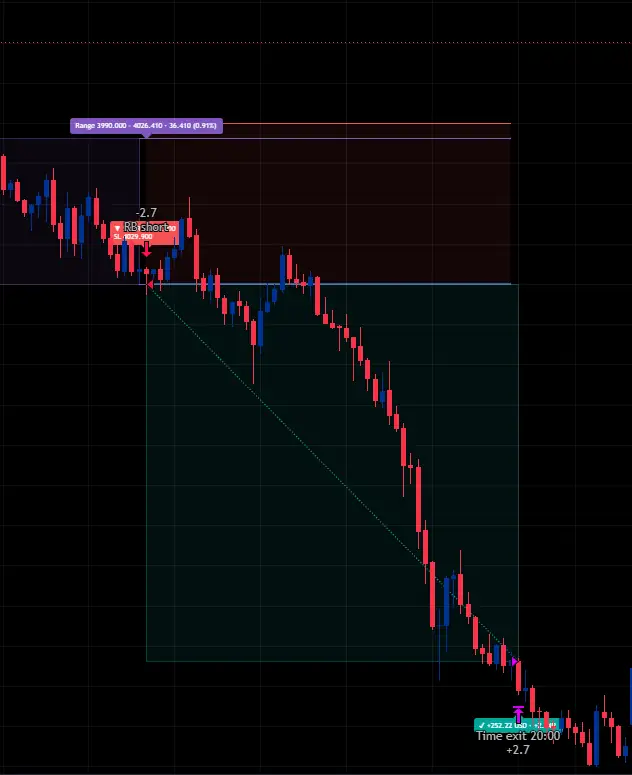
These are individual examples from the historical test, not a typical daily profit or a promise about what the next breakout will do.
Gold Breakout 15M backtest results
I used the TradingView Strategy Tester on TVC:GOLD, 15-minute candles, for August 3 to November 11, 2026. The test started with 10,000 USD. Over that sample, the strategy closed 67 trades, of which 40 were profitable and 27 were losing trades.
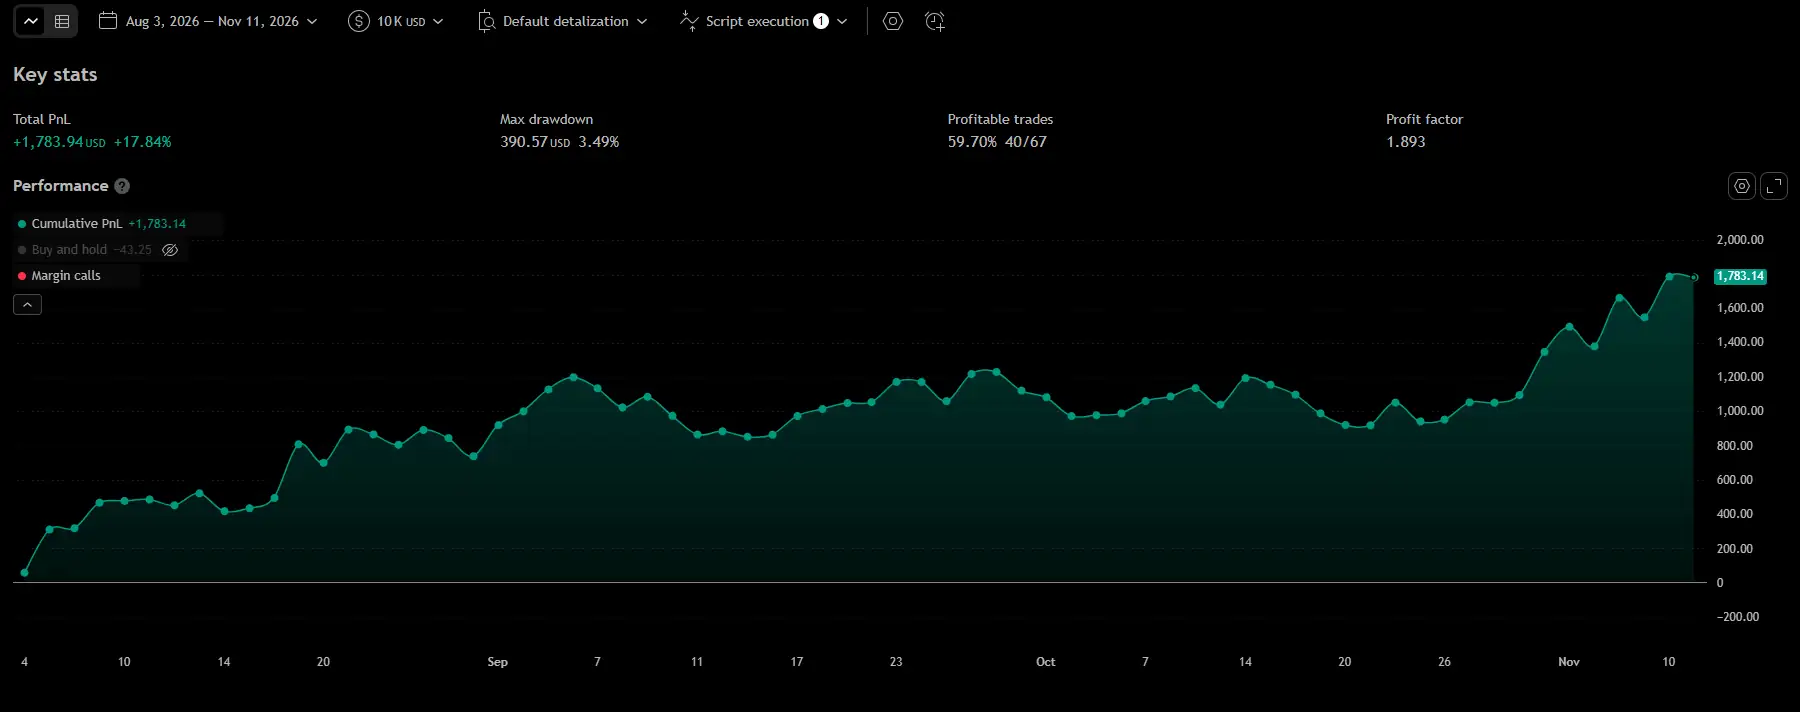
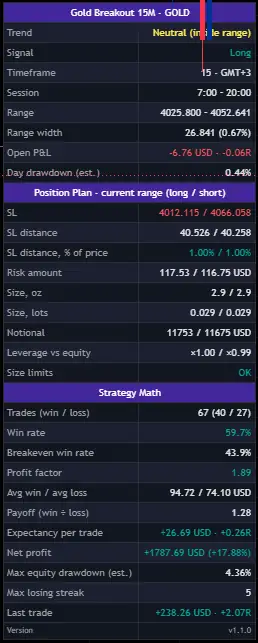
The average winner was 94.72 USD and the average loser was 74.10 USD, giving a payoff ratio of 1.28. The reported expectancy was +26.69 USD per trade, or about +0.26R, and the longest losing streak was five trades. The separate intrabar drawdown estimate shown in the script was 4.36%, which is higher than the Strategy Tester drawdown figure.
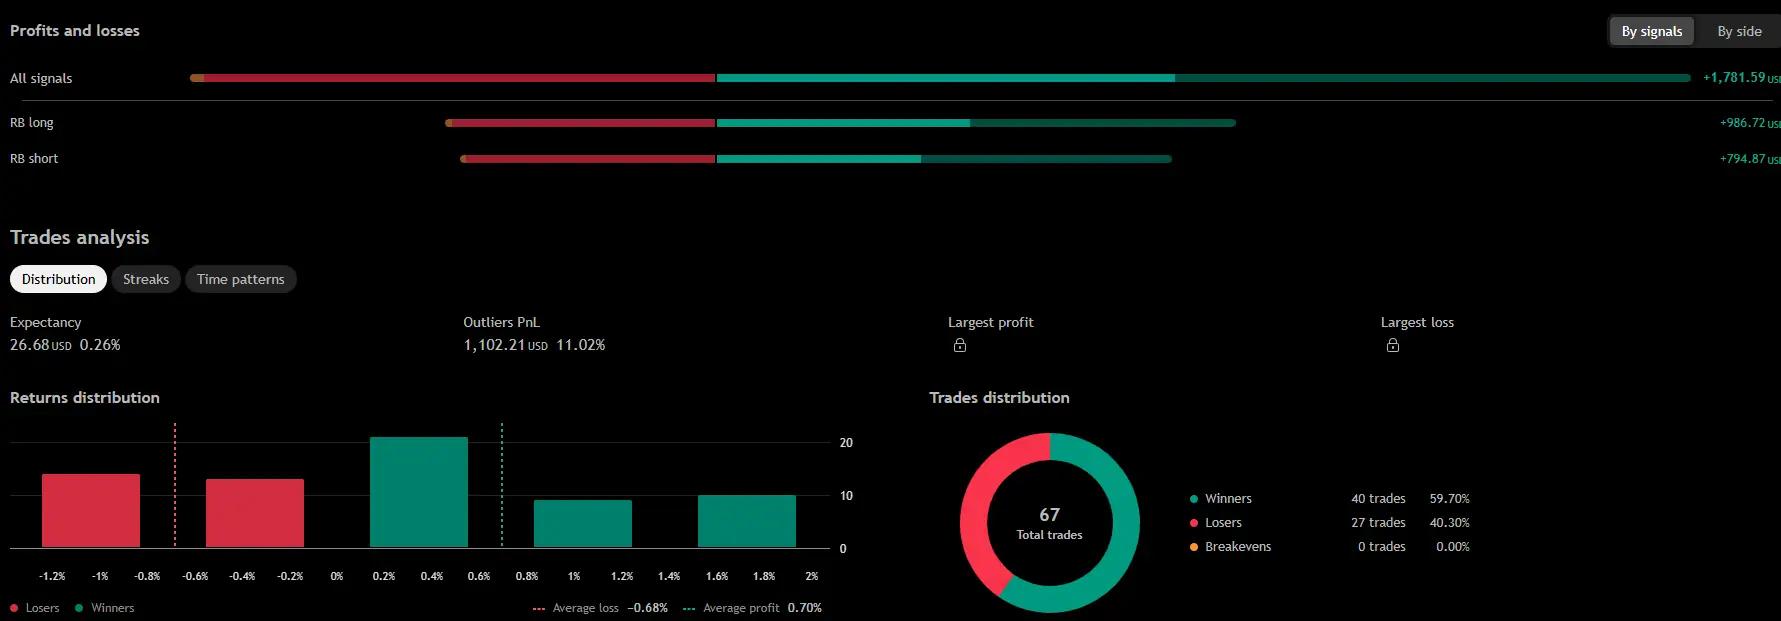
A good-looking backtest is a starting point for investigation, not a reason to assume live profitability. This is roughly a three-month sample on one data feed. The published test used 0.40 USD commission per order, zero slippage, and did not model spread. Different gold feeds, trading costs, contract specifications and session clocks can change the result substantially. Small differences between the original screenshot panels reflect live chart updates and an open trade at capture time.
Risk management is part of the strategy, not an afterthought
The default stop is 1% from the entry price. You can change it to the opposite boundary of the overnight range if you prefer a stop based on market structure. In percentage mode, the script recalculates the stop once using the actual simulated fill price.
Position size can be based on a target percentage of account equity at risk, set to 1% by default, or entered as a fixed quantity. The calculated order size is capped by the maximum leverage setting, 10x by default, and rounded down to the symbol's quantity step. If a position is smaller than one allowed step, the strategy skips it.
The risk amount is a planning estimate, not a guaranteed maximum loss. Gaps, commissions, spread, slippage and execution behavior can increase realized losses. For futures such as Micro Gold (MGC), review the contract's point value, contract step, trading session and the broker's margin requirements before trusting the position size or comparing backtests. The results above were not tested on MGC.
An optional prop-firm-style guard can close positions and halt the day's trading after an estimated daily equity drawdown threshold. It is off by default, acts at bar close, and cannot guarantee compliance with a firm's loss limit.
A dashboard that explains what the script is doing
The chart includes a dashboard so you do not have to guess why a trade did or did not appear. It shows the current session, trend relative to the range, planned stop levels, risk amount, position size, leverage, open P&L, and the running strategy statistics.
Settings worth checking before your first test
Start with the 15-minute chart and regular candles. The range is most accurate when the chart interval divides an hour evenly, such as 5, 10, 15, 30 or 60 minutes. The strategy warns about nonstandard charts or incompatible timeframes but does not automatically disable trades for those warnings.
The most important setting is the broker clock. If the broker's server moves between GMT+2 and GMT+3 with daylight saving time, selecting a fixed GMT+3 value all year can shift your range by an hour. Use the available New York + 7 hours mode when it matches your broker, or enter the correct fixed timezone.
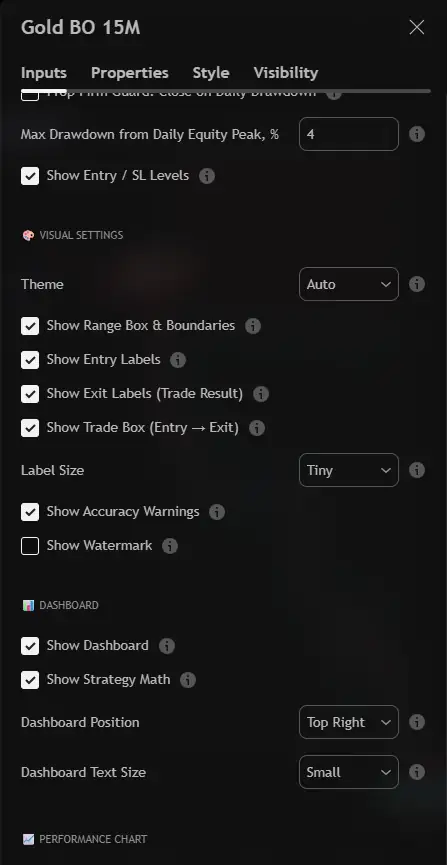
The built-in cumulative P&L panel is optional and off by default. It uses trades available on the loaded chart, so it should not be confused with results from a separate Deep Backtesting range.
Alerts and automation
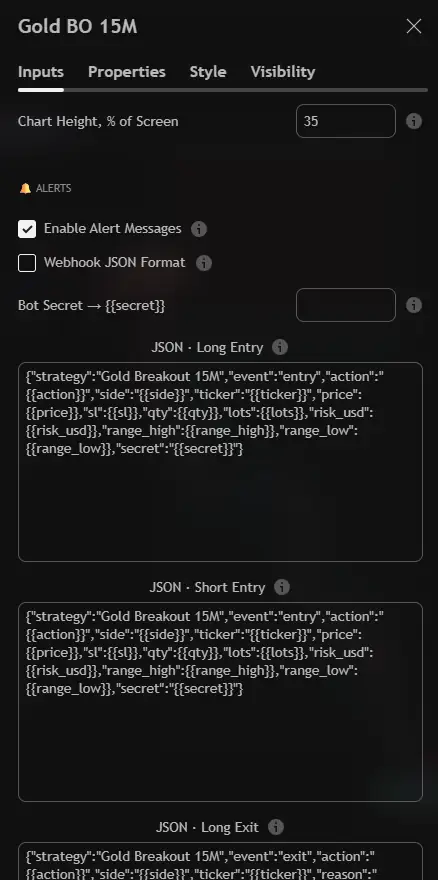
The Pine v6 strategy includes order alert messages for entries and exits. You can choose readable text or editable JSON templates containing the symbol, direction, order level, stop, quantity and range. It can be connected to a webhook workflow when the TradingView account and downstream service support that setup.
For a TradingView strategy alert, use {{strategy.order.alert_message}} as the alert message. The script also includes an optional secret placeholder. Treat that value as sensitive because it is stored in chart settings, and never share a screenshot that exposes it.
For a separate example of visual-signal automation without relying on TradingView technical alerts, read the TradingView to Binance visual bridge guide. That is a different implementation, not an automatic feature of this gold strategy.
How to install the free Pine Script in TradingView
- Use the free download button to get
gold-breakout-15m.pine. The site asks you to sign in with Google once; it does not ask for your trading account credentials. - Open TradingView and select the gold chart or another instrument you want to test.
- Open Pine Editor, paste the source code from the downloaded file, save it, and add the strategy to the chart.
- Set the chart timeframe to 15 minutes, then check broker timezone, range hours, stop-loss, risk and commission settings.
- Open Strategy Tester and compare the signals, fills and costs with your own market and data feed before considering any live use.
Common questions
Does this gold breakout strategy repaint?
The supplied code evaluates its strategy logic on completed bars and submits orders for simulated fills from the next bar. It does not use an intentional future-bar lookahead mechanism. That does not mean all historical and live fills will match, especially with gaps, intrabar volatility or different market data.
Can I use it on XAUUSD or Micro Gold futures?
The script can be added to other compatible symbols, and it contains size-label handling for several gold instruments. The documented backtest is specifically for TVC:GOLD on the 15-minute chart. XAUUSD and MGC have different data, spread, contract and broker-session characteristics, so test them separately.
Why is there no take-profit?
That is part of the setup. The position is allowed to run until the stop-loss or closing time. You can adjust stop placement, but the supplied version does not have a fixed profit target.
Why do my backtest results look different?
Check that the symbol, date range, broker timezone, commission, slippage, contract size and TradingView Strategy Tester settings match. The source test used zero slippage and did not include spread. Even a one-hour session shift can change which range gets traded.
Ready to put the rules on your chart?
Download the complete strategy and test it with your own gold symbol, timezone and costs. The code includes the range visuals, risk controls, dashboard and order alerts.
Download Gold Breakout 15M ↓One Google sign-in unlocks the free scripts on this site. No credit card required.
Having trouble installing or configuring this strategy? Email [email protected]. I can help you check the script setup, but backtest figures are not financial advice.
Want to compare a different approach? You can also try the free Supertrend + DEMA reversal strategy, which follows trend signals rather than daily range breakouts.